Viewing data
On The Conservation Hub's web app, you can view your data in a table, map, or board to monitor, manage, and report on your team's submissions.
There are two ways to view your data on The Conservation Hub. The first way is viewing your data against a specific project, which any usere with access can do. The second way, which is for admin users only, is to view your data against a specific form, which collates all of the submitted data across all of the projects where that form is used.
Viewing project data
To get started, follow these steps:
- First log into the app and select a group.
- Then, in the left sidebar, press Projects
- Then, click on the project you would like to view data for.
- On the project page, under Project Forms, click on the form you would like to view data for.
If you are not a group admin, you will only see the project data that you submitted.
Viewing form data (Admin only)
To view form data across all projects where that form is added, follow these steps:
- First log into the app and select a group.
- Then, in the left sidebar, press Forms
- Then, click on the form you would like to view data for.
The table view
The table view is how you will first see your data when you open a form. The table columns that you see are set up when the form is created, admins can change the columns shown in the form settings.
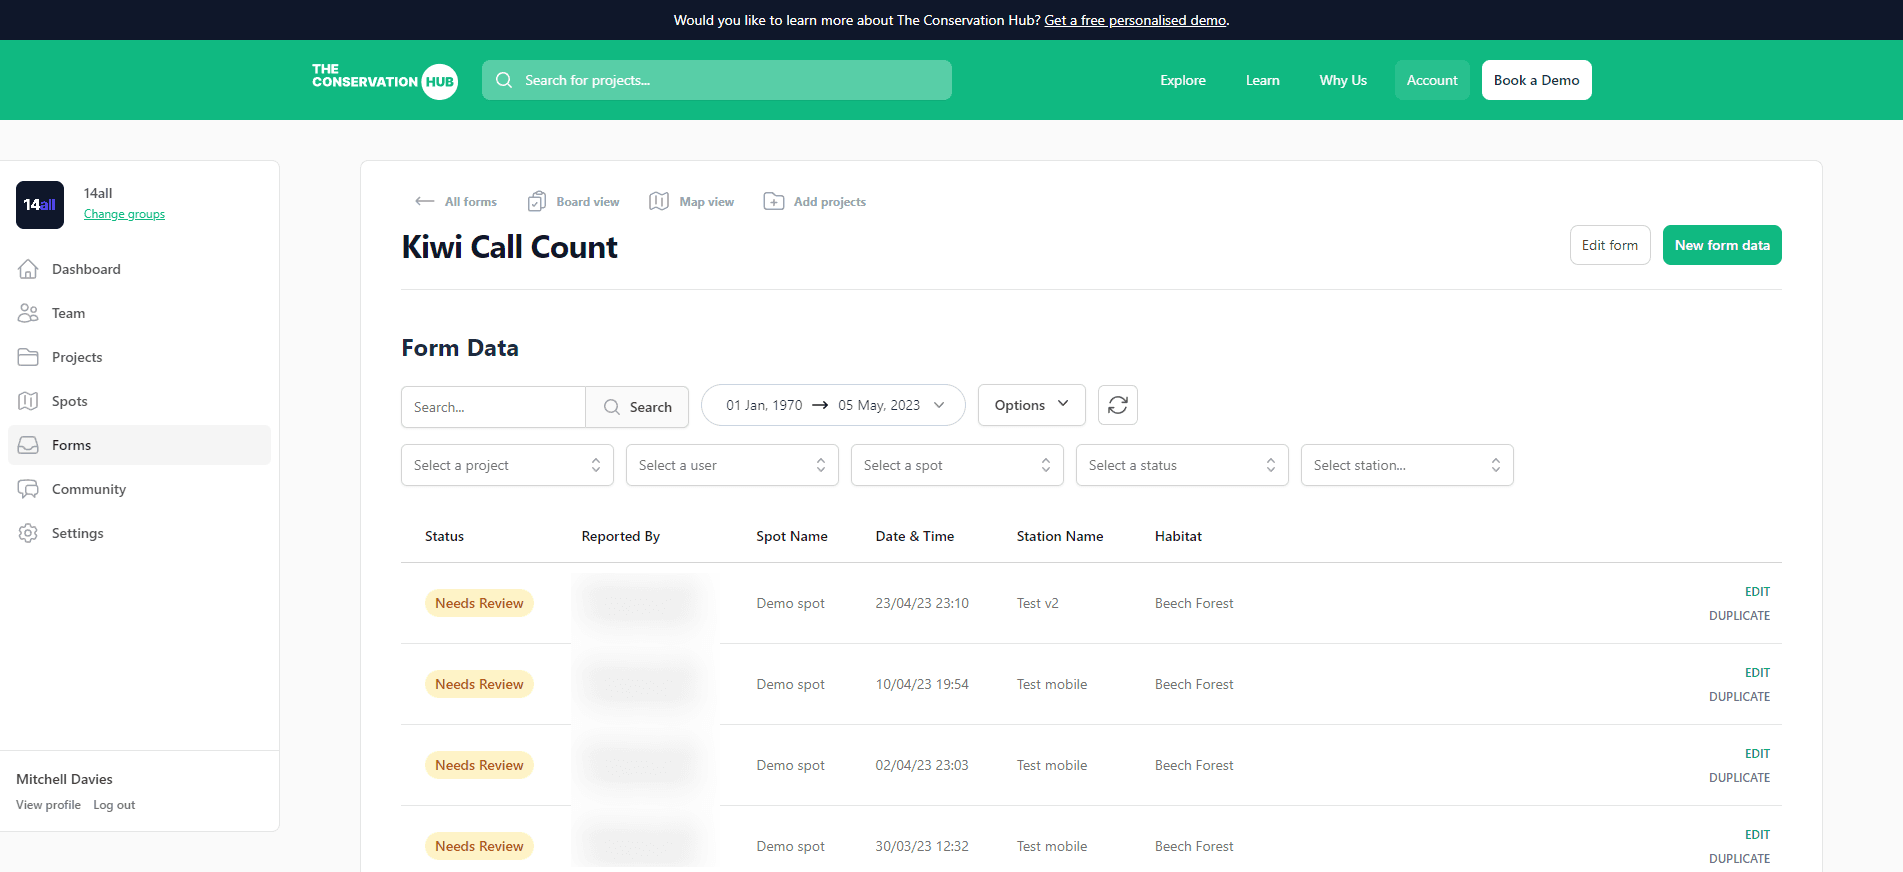
By default, form data is sorted by the first date field in your form, but you can click on any of the table columns to resort the data in either ascending or descending order for that specific column.
If your form admin has enabled editing your past submissions, you will see an Edit and Duplicate button on the right side of the table where you open the form to view more details, edit it, or create a copy of a form record.
You can search for form records by typing your query into the search bar above the table and pressing Search. Search results are shown based on all data inside of the form.
By default, you will see the last 30 days of form data. You can change your date range by pressing the date filter button above the table, which will open a calendar. To change the date range, first click on the day you would like to be the start of the range, then press the day you would like to be the end of your range, and then press the apply button at the bottom.
Under the Options dropdown you can export or import data. If you form has special functions, imports, or exports you will see that under the Options dropdown as well.
The button to the right of the Options dropdown is the refresh button. Clicking this button will refresh your table data.
The bottom rows of filters lets you filter by project, user, spot, status or other filterable fields for your form.
To change to the map or board view, click the Board view or Map view button at the top of the page.
The map view
To change to the map or board view, click Map view button at the top of the page.
The map view shows all of your data as pin markers or polygons on a map. To open one of the submissions for more detail, click on the pin.
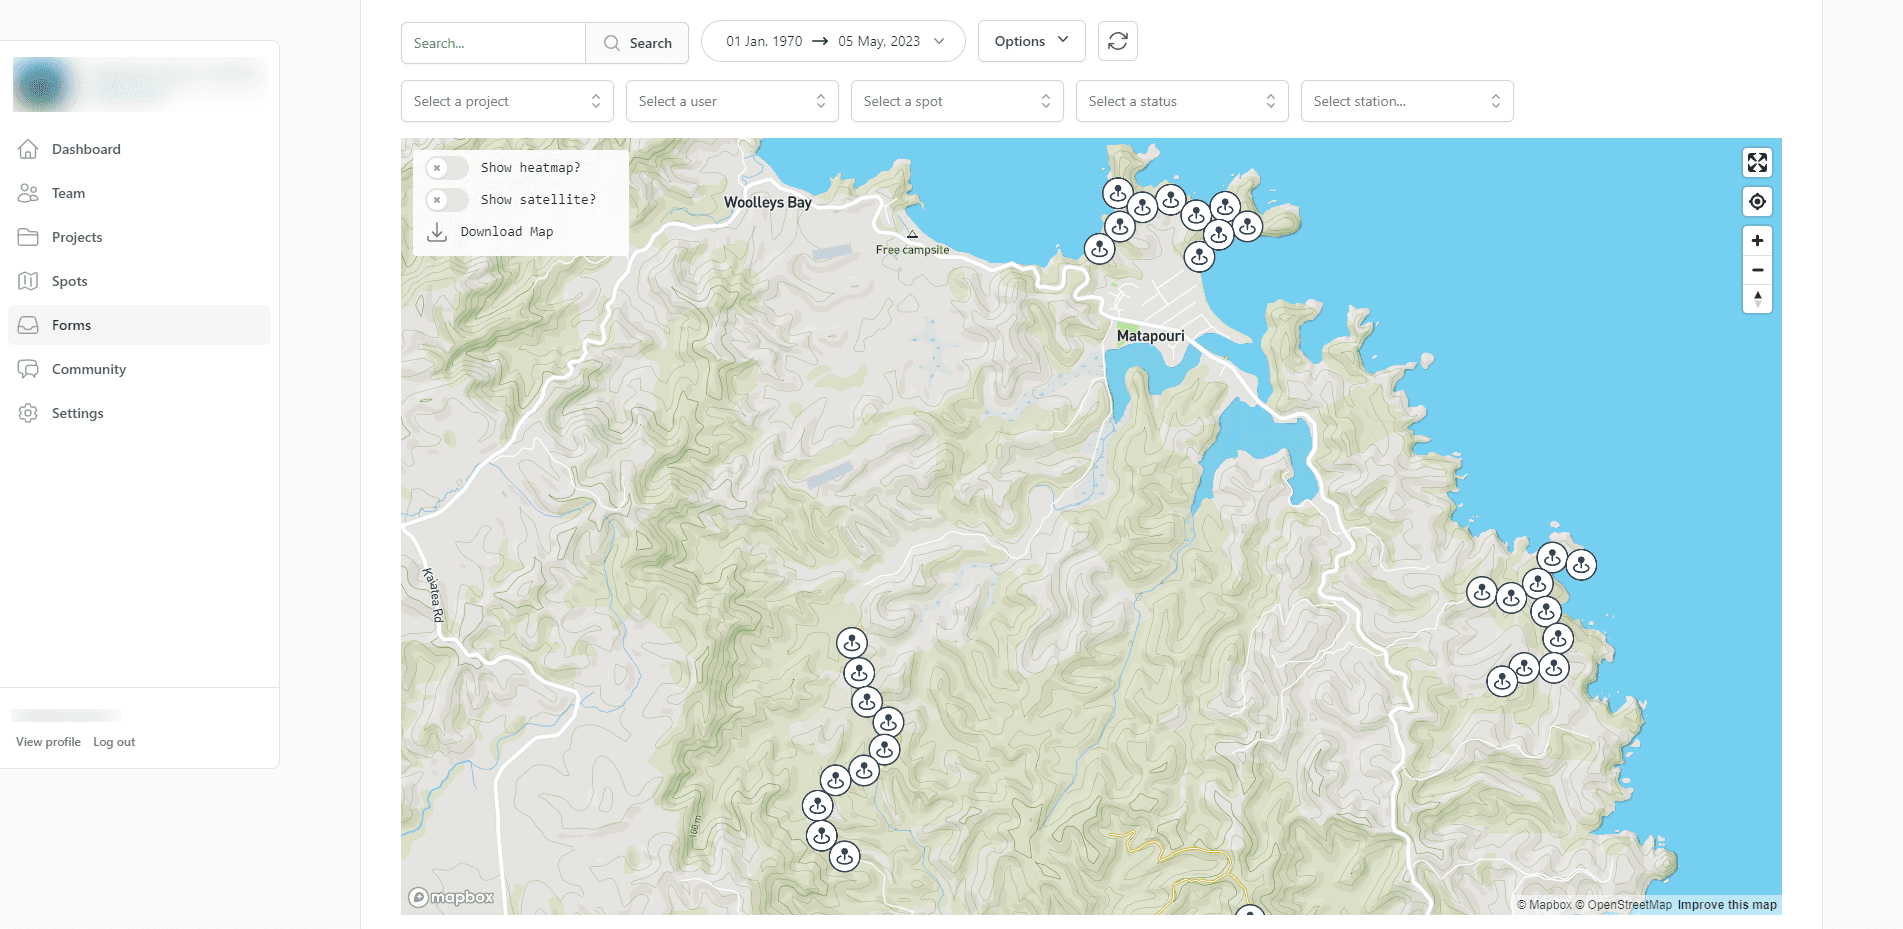
In the top left of the map, you can enable showing your data as a heatmap, enable showing a satellite map, or download your map view as an image.
If you do not see any pin markers or polgyons on your map, ensure there are no filters being applied that is excluding your data, and check your date range.
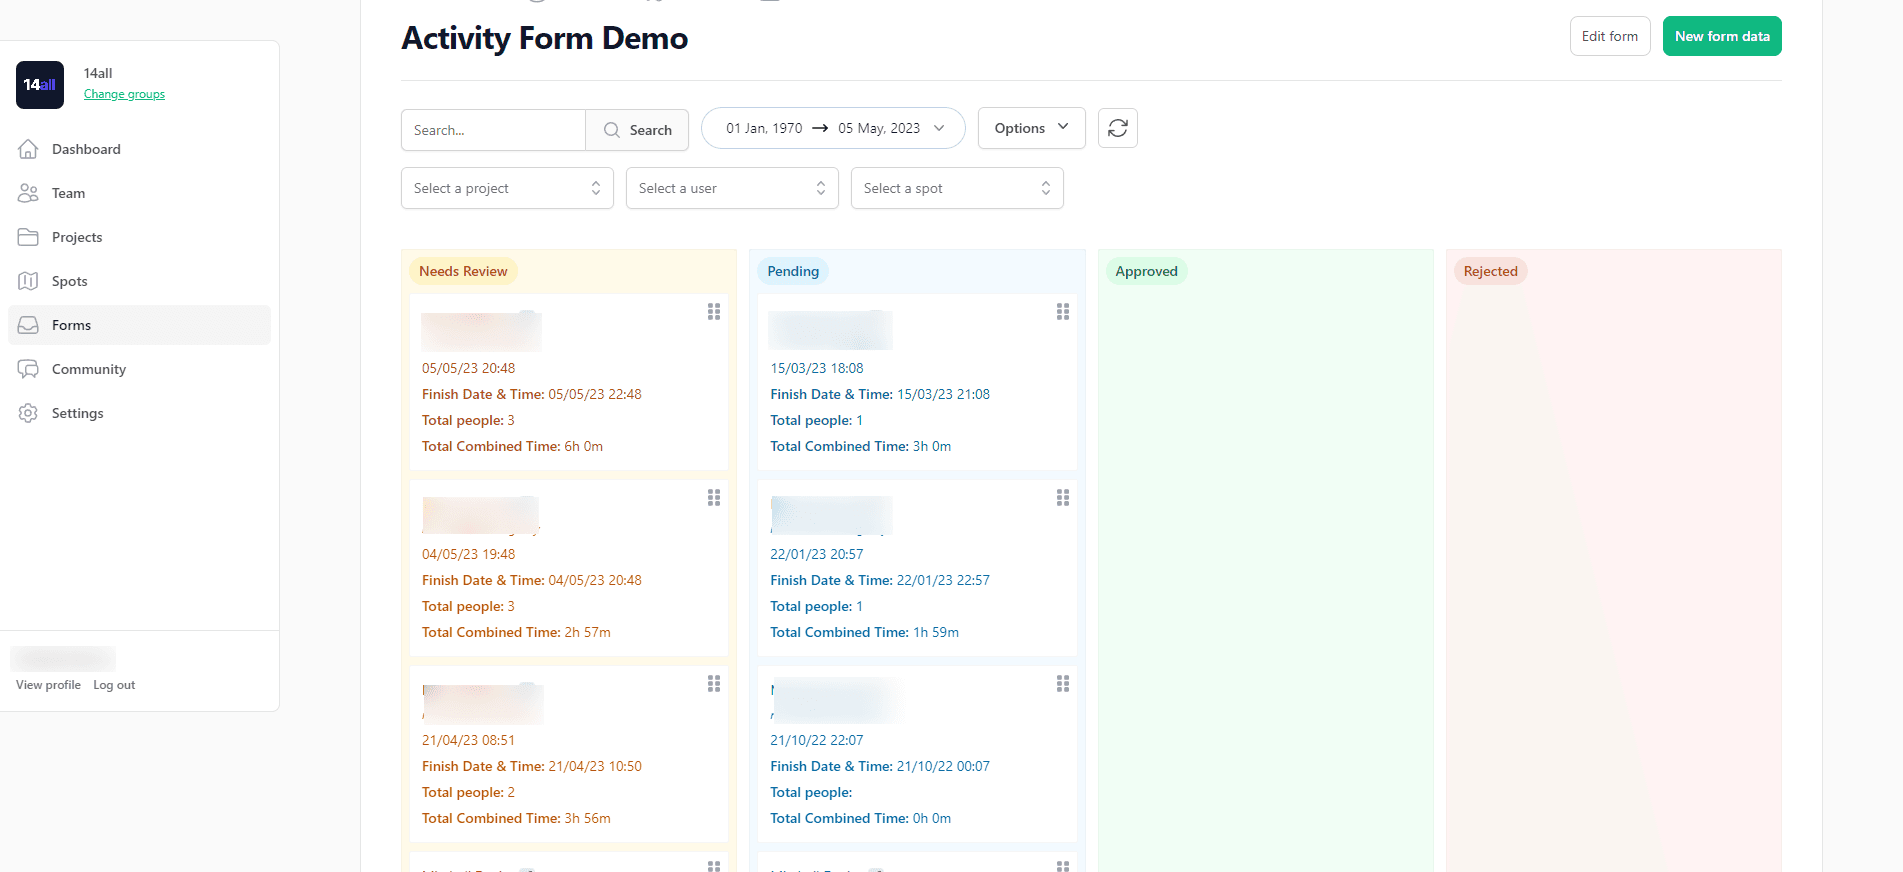
The board view
To change to the map or board view, click Board view button at the top of the page.
The board view groups all of your data by status. You can quickly change the status of a form submission by dragging and dropping it into a different column.